
Power BI is a tool used by NYCC to visualise data and share important insights. Below are a series of frequently asked questions and answers.
If you find that your question is not here, or if one of the solutions provided does not work for you, please email bi.operations@northyorks.gov.uk.
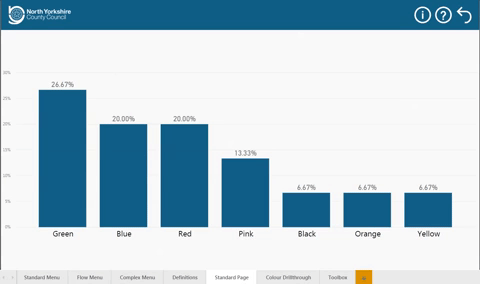
Tooltips are effectively popups that can be used to display details that may otherwise clutter a page. If you hover your mouse over something like a bar in a graph and leave it there, you may notice a tooltip pop up.
In the video, the graph shows people’s favourite colours. We can see that green makes up 26.67% of the cohort. By hovering over bar, we can see that 4 people chose green.
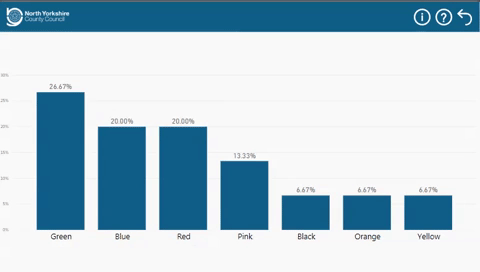
There will be times when you want to view data in more detail i.e. at a person by person level.
This is often possible through a ‘Drillthrough’. Right click on the bar you wish to Drillthrough on, hover your mouse on the word ‘Drillthrough’ and select which Drillthrough you require.
As you can see in the video, the page you are taken to has the relevant filters applied. In this case you can see all the respondents who selected ‘Green’ as their favourite colour.
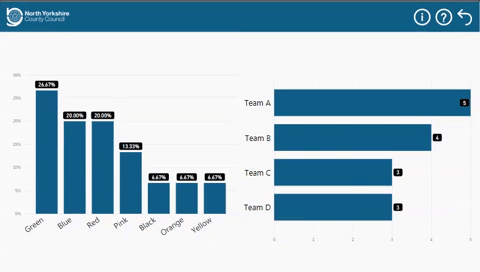
There may be dropdown boxes or buttons on a page which you can use. You can also use visuals to filter other data on the page - when you click on a bar in a graph, it may have an effect on other visuals.
In the video, by clicking on a team’s bar on the visual on the right, the visual on the left filters only displays results relevant to the selected team.
There are instances where this feature has been disabled. If you believe that it should be working (and isn’t) please contact bi.operations@northyorks.gov.uk.
You can export the data from certain visuals.
To do this, hover your mouse over a visual. Three horizontal dots will appear in the top right corner. Click this, and select ‘Export data’.
This will then give you the option to save the data as a CSV. Please note, PowerBI can only export up to 30,000 rows of data.

Most of our products contain a page for ‘Data Definitions’.
If you are unsure about the source of the data, or if you’re curious how certain figures are worked out, this page is where you should look. You can access it by clicking the 'i' in the top right corner.
If you require additional definitions to be added to a product or if you believe any existing definition to be incorrect, please contact bi.operations@northyorks.gov.uk.

Products are put on a ‘refresh schedule’. This is a set time for data to be extracted wherever it is stored and uploaded for you to view.
Depending on what has been agreed, a product might be refreshed daily or weekly.
You can see when a product was last refreshed by looking at the bottom left corner of the home page.

If you believe that the product you’re using is not working correctly, has not refreshed as expected, or is not reporting the data you would expect, please email bi.operations@northyorks.gov.uk.
Please provide the name of the product as well as a description of the problem.