

Background to the Indices of Deprivation
The Indices of Deprivation are published by the Department for Communities & Local Government (DCLG). The latest version are the Indices of Deprivation 2015, providing an update to the Indices of Deprivation 2010. They include ranks and scores for all 32,844 Lower Super Output Areas (LSOAs) in England, together with summary information at local authority level.
The overall Index of Multiple Deprivation is part of the Indices of Deprivation dataset. It is calculated from a combination of seven domains - Income; Employment; Health; Education; Barriers to Housing and Services; Crime; and Living Environment.
Detailed information is available on each of these aspects of deprivation by clicking on the domain name.
In addition there are separate sub-domains with the Education, Barriers to Housing and Services and Living Environment domains and two additional income indicators – the Income Deprivation Affecting Children Index (IDACI) and the Income Deprivation Affecting Older People Index (IDAOPI) which provide more detailed information on specific aspects of deprivation.
The way in which the domains, sub-domains and indicators are calculated has been changed as little as possible between the 2010 and 2015 indices, so the data for the two time periods are largely comparable. The underlying statistics used in calculating the Indices of Deprivation 2015 are from 2012/13.
It is important to note that that a change in the rank of an individual local authority or LSOA indicates change relative to other areas in England. It does not necessarily indicate that the area has become more or less deprived in absolute terms.
Index of Multiple Deprivation North Yorkshire Summary
At local authority level North Yorkshire is among the least deprived in England. It is ranked 125th least deprived out of 152 upper tier local authorities for the Index of Multiple Deprivation (IMD), a similar position to 2010 when the county was ranked 129th out of 149 upper tier local authorities.
Scarborough continues to be the most deprived district in North Yorkshire for the Index of Multiple Deprivation. It is ranked 90th most deprived out of 326 lower tier local authorities, but it is relatively less deprived than in 2010, when it was in 83rd place.
At LSOA level the Indices of Deprivation 2015 show that pockets of high levels of deprivation are found within North Yorkshire. Three LSOAs in Scarborough town are within the most deprived 1% in England (parts of Woodlands, Eastfield and Castle wards).
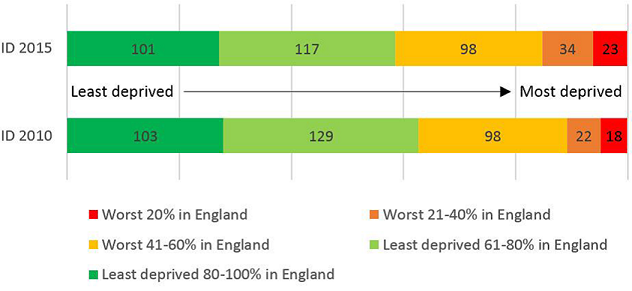
More of the county’s LSOAs now fall within the lowest quintile (most deprived 20%) in England in the Index of Multiple Deprivation, increasing from 18 in 2010 to 23 in the 2015 dataset. The increased number covers parts of Colburn and Filey, together with additional parts of Scarborough and Selby.
The number in the second most deprived national quintile has also increased, from 22 in 2010 to 34 in 2015.
| LSOA name | Broad description | IMD 2015 rank in England |
| Scarborough 007D | Scarborough town - northern part of Barrowcliff | 313 |
| Scarborough 012B | Eastfield - area around Dale Edge and Ridgeway | 318 |
| Scarborough 006B | Scarborough town - Castle ward, around St Thomas & St Nicholas Streets | 319 |
| Scarborough 006D | Scarborough town - area around Queen's Parade & Trafalgar Square | 751 |
| Scarborough 010A | Scarborough town - southern part of Castle ward | 1005 |
| Scarborough 012A | Eastfield - southern part of Eastfield ward | 1714 |
| Selby 005C | Selby West ward - area around Charles Street | 2057 |
| Harrogate 013F | Harrogate town - area around Woodfield Drive | 2283 |
| Scarborough 012C | Eastfield - area around Caymer Road & Herdborough Road | 2515 |
| Scarborough 006A | Scarborough town - eastern part of Castle ward | 2561 |
| Scarborough 001C | Whitby - West Cliff, area south of North Trrace | 2792 |
| Scarborough 010B | Scarborough town - area around Royal Avenue & Westbourne Grove | 3907 |
| Scarborough 008C | Scarborough town - Central ward, area east of Victoria Road | 5140 |
| Scarborough 007C | Scarborough town - southern part of Barrowcliff/Prospect Mount | 5328 |
| Scarborough 009B | Falsgrave Park - Edgehill area | 5334 |
| Richmondshire 004A | Colburn - area around Forest Drive and Grange Road | 5380 |
| Scarborough 014A | Filey - eastern part of Filey ward | 5533 |
| Scarborough 007B | Scarborough town - area west of North Leas Avenue | 5732 |
| Craven 006B | Skipton South ward - Horse Close area | 5801 |
| Scarborough 003B | Whitby - Streonshalh ward around Abbot's Road & St Peter's Court | 5885 |
| Scarborough 010D | Scarborough town - area east of Belmont Road | 5992 |
| Craven 005D | Skipton South ward - Greatwood area | 6114 |
| Selby 005E | Selby East ward - between New Lane and Volta Street | 6430 |
BOLD = additional areas which fall within the lowest quintile in IMD 2015 which were outside it in IMD 2010.
Ranks are out of 32,844 LSOAs in England. Ranks closest to 1 are the most deprived
Further information
For more information on this data contact population.statistics@northyorks.gov.uk